How long will I live?
You may be surprised, but this question has a mathematical answer. By inputting your date of birth, country of birth, and sex at birth into population.io, you can predict how long you’re expected to live.
For example, Trevor Noah, who spoke alongside World Data Lab’s Wolfgang Fengler at the Global Inclusive Growth summit was born on February 20, 1984. If he had stayed in South Africa, he would be predicted to live until August 14, 2054, giving him only 31 years left. However, by moving to the US, his life expectancy increased by 13 years, with an estimated lifespan through November 26, 2067.
If Trevor were to live in Chad, he would only be expected to live another 29.7 years, making it one of the few countries where Trevor’s life would be shorter than in South Africa.
On the other hand, Switzerland, the birthplace of his father, is the best country for Trevor’s longevity, where he would have 48.2 years left to live. That’s a 20-year life expectancy gap between Chad and Switzerland.
On a macro scale, 68 million people will die this year. And too many will die young, with 28 million dying before the age of 65 (young) and 40 million people dying after (old).
Asia has the most deaths due to its large population, with 23 million dying old, and 14 million dying young. In the Americas, 6.5 million older and 4 million young people die. In Europe, 7.5 million older people will die this year, and only 1 million will die young.
Finally, in Africa, 2.5 million older people and a staggering 9 million young people die. That means for every African that dies old this year, almost four Africans die young.
It is clear that there are significant inequalities in life expectancy based on location, which highlights a need for global action. While everyone will die eventually, we should strive for people to have the opportunity to live long, fulfilling lives- no matter where they’re born. It’s critical to reduce the number of premature deaths, and eventually, bring the number 28 million down to zero.
How much money will we earn?
Or, put differently, how much do people spend?
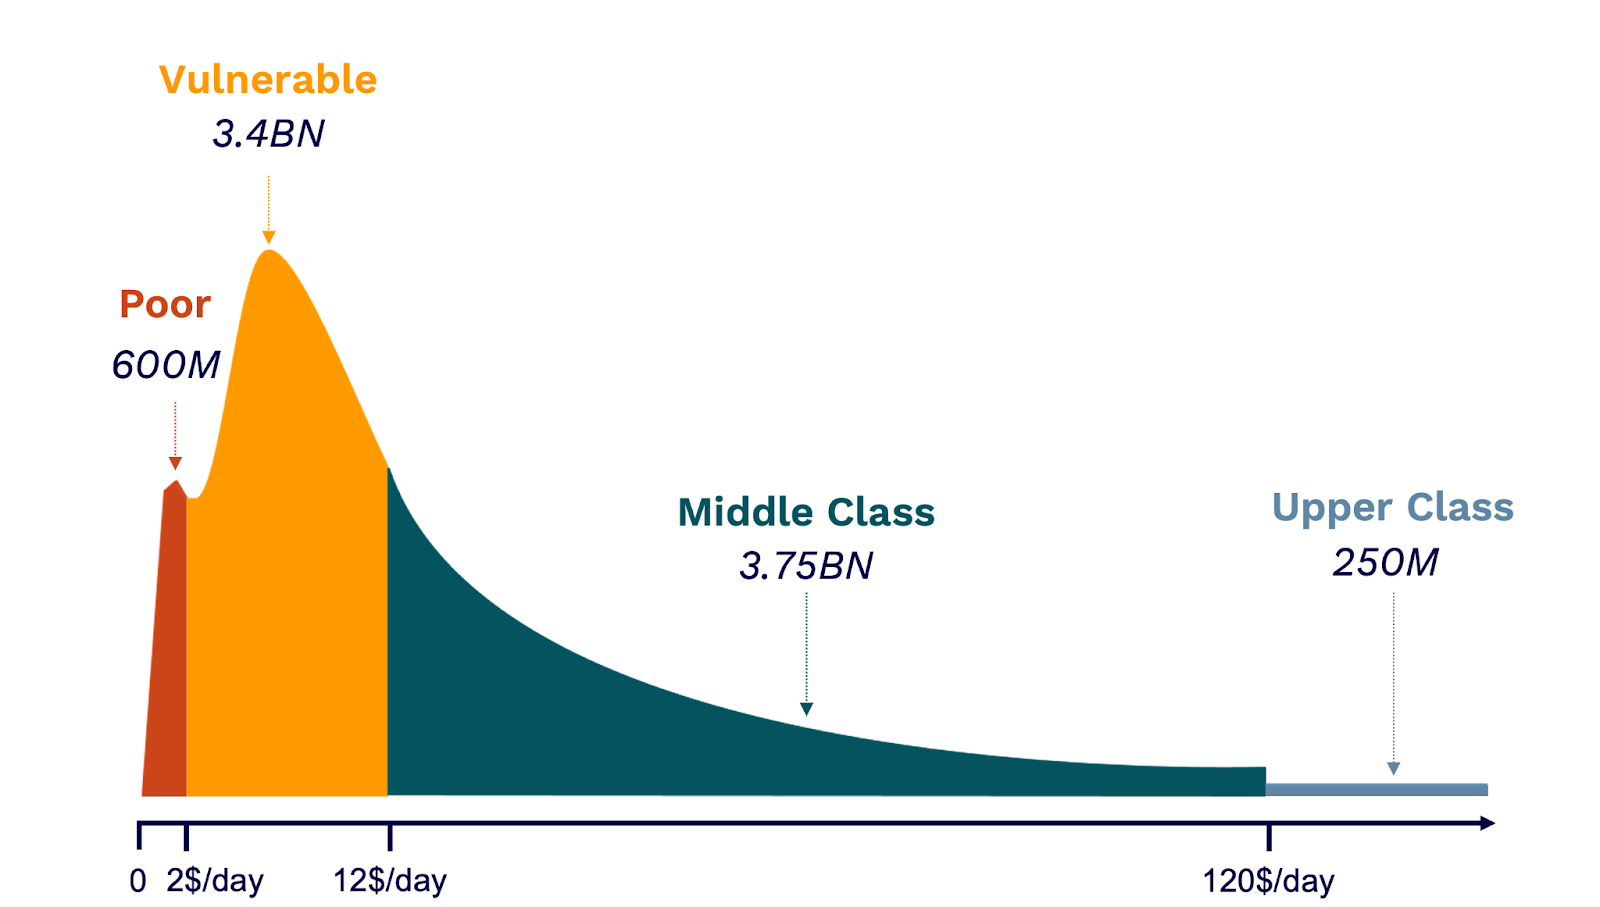
We have global definitions for spending thresholds. Roughly $2 represents extreme poverty. $12 marks the beginning of the middle class, and people start to consume and live a modern life. 600 million people still live in extreme poverty, while 3.4 billion are vulnerable ( the US or European definition of poverty). On the positive side, 3.75 billion people fall into the middle class category , and 250 million are categorized as upper class or wealthy.

This means that 4 million people fall into the poor and vulnerable brackets, while 4 million people are middle or upper class. Although this historic moment means that half of the world’s population is middle class or above, it also means that half of the world’s population is still struggling.
The future, however, is promising. The middle class is growing rapidly, with four people joining per second, mainly in Asia. In the next decade, we will experience middle-class dominance globally, with an estimated 5 billion middle-class consumers. Though this decade is Asia’s, the following decade will see Africa as the emerging market.
While growth of the middle class provides opportunities for economic development and improved living standards, concerns about sustainablities arise. Increased consumption may exacerbate our already devastating environmental challenges.
Can we still prosper and manage climate change?
Looking at our World Emissions Clock, the number of emissions we produce are daunting. Every second, we emit 2000 tonnes of greenhouse gas (GHG) emissions, adding up to 100,000 tonnes per minute and 58 gigatonnes per year. These emissions come from various countries and sectors.
Perhaps surprisingly, the US is not the worst emitting per capita among the G20, but Saudi Arabia. Saudi Arabia emits 26 tons per capita, almost four times more than the global average of 7.4 tonnes per year.
The number two emitter per capita is Canada, number three is Australia, and the US is in fourth place at 18.4 tonnes per capita. Much of these emissions are attributed to energy and transport. In terms of total emissions, the US is still number two after China.
The EU is surprisingly low, only 8.2 tonnes per capita. So a European has roughly half of an American. However, these numbers are still higher than the global average, and unsustainable.
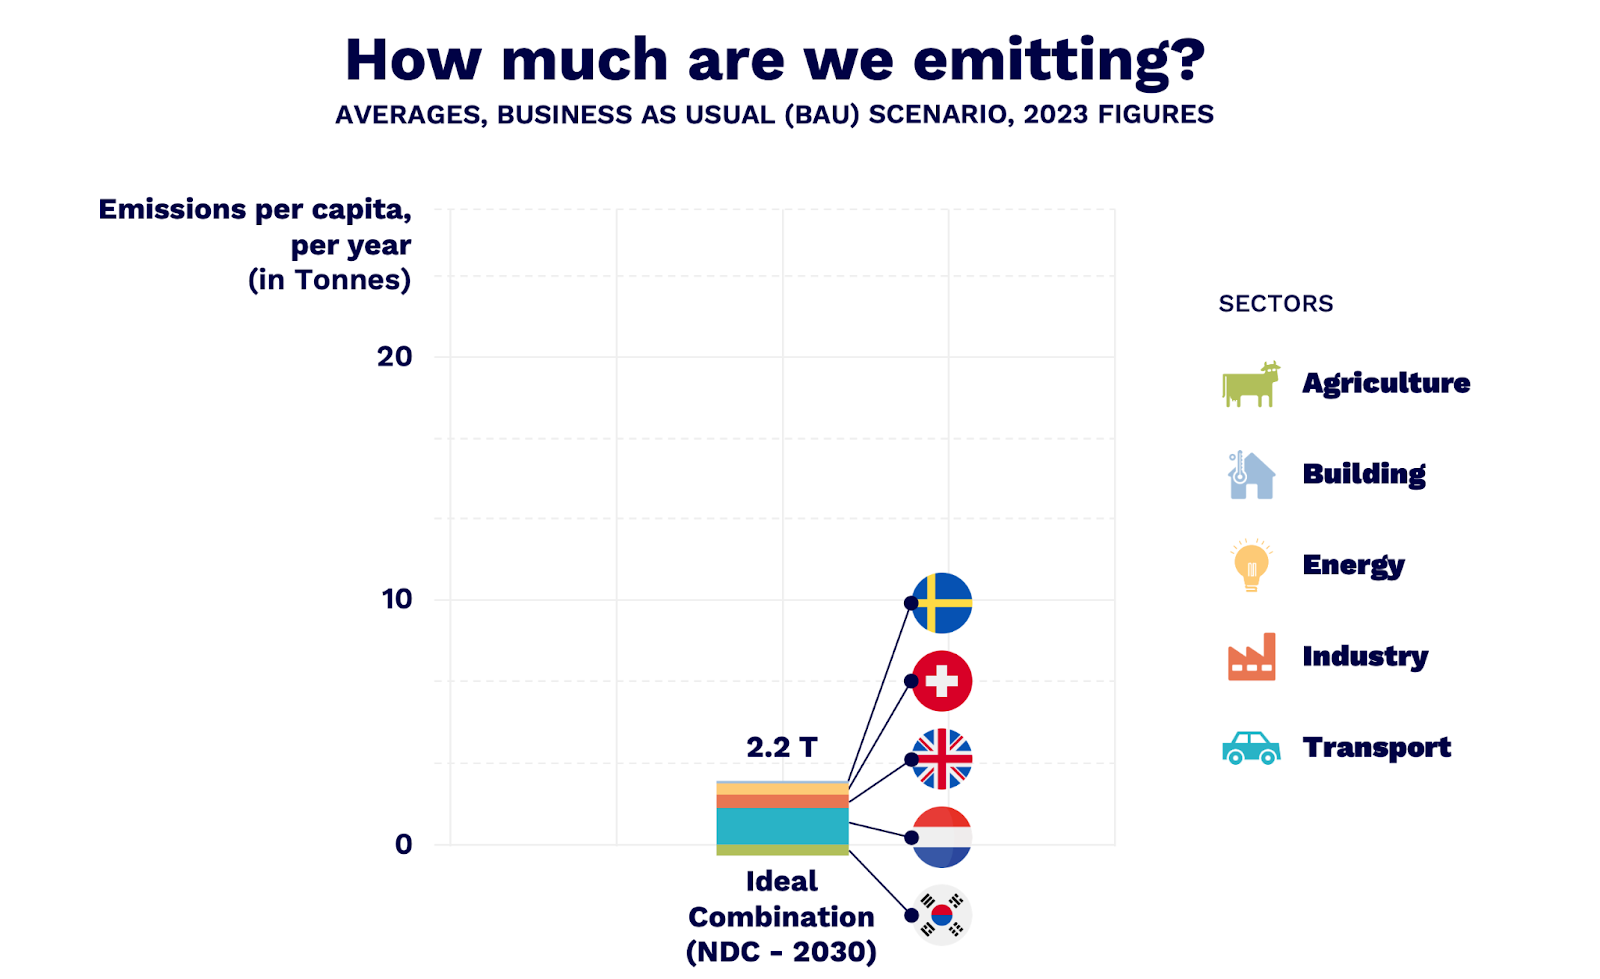
Fortunately, some wealthy countries have been successful in reducing their emissions in certain sectors while maintaining their high standard of living. The Netherlands leads in transport, the UK has made strides in reducing industrial emissions, and Switzerland relies on clean energy. Sweden has achieved almost zero emissions buildings, and South Korea’s successful reforestation program has resulted in negative emissions from its agricultural sector.
If we create a hybrid of the best practices from these countries and sectors, we achieve a low emissions rate of 3.1 tonnes per capita. If we factor in their promises, we can reach 2.2 tonnes, well below the 3.6 tonnes stipulated by the Paris Agreement for 2030.

In conclusion, climate action should not be a trade-off between consumption and sustainability. We need to be more ambitious. We should strive to create a clean, safe, prosperous world for all – with data.


