Water Scarcity Clock
Real time water scarcity forecasts
The world is running out of water. The Water Scarcity Clock was created in collaboration with the Deutsche Gesellschaft für Internationale Zusammenarbeit (GIZ) and the International Institute for Applied Systems Analysis (IIASA) to bring increased awareness to this issue.
A Consistent Global Modal
The model for the Water Scarcity Clock is based on water data from grids of the size 0.5×0.5 degrees. Each grid contains population and overall water availability for that area. Based on this data we calculate the average water availability per capita per year for each grid. The grids are then summed up to get the country number. Based on these grids, we are able to express what percentage of the population lives in areas with an average water availability of less than 500m³, 500m³ to 1,000m³, 1,000m³ to 1,700m³ and more than 1,700m³. The sum of all countries is the headline number which shows the number of people living in areas with less than 1000m³ of water per capita per year.
Forecasts for every country in the world
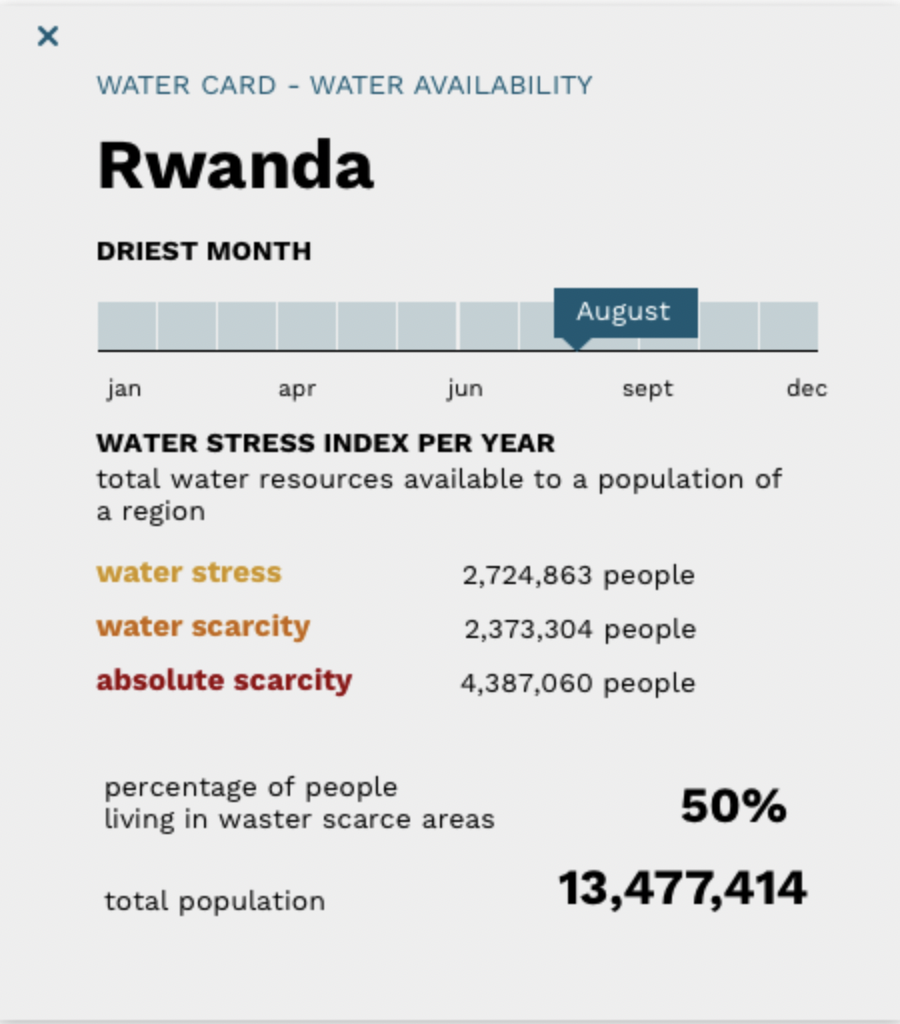
Find out how many people in every country in the world suffer from water stress, water scarcity, and absolute scarcity. See which month of the year is the driest month for each country and how water scarcity changes in these months. Compare this year’s data with projections from 2030.


